Robocode/Eclipse/Debugging Robot
This page describes how to use the Eclipse IDE for debugging your robots.
Contents
Debugging your robot with Eclipse
In some situations, you might want to debug your robot by setting break points (e.g. conditional breakpoints), step through lines of codes and see how the values of your variables changes as the code goes along, or just check if an event handler is ever being called.
Fortunately, this is possible to do with Robocode!
Before you can start debugging with Eclipse, you must be able to run your robot from Eclipse. So if you have not already set up your project accordingly to Running your robot from Eclipse, you must do this before you are able to proceed with debugging.
Notice: You must also add -Ddebug=true to the VM argument too. This will slow your Robocode down a little, but if this flag is missing, the Robocode will freeze when it reach the breakpoint.
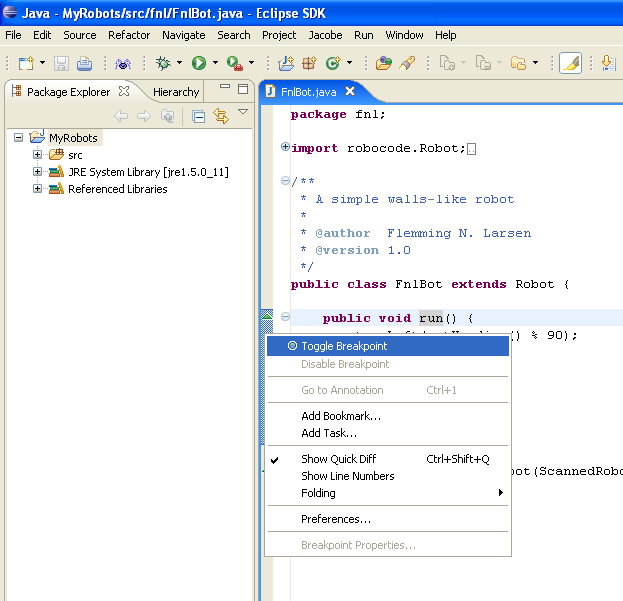
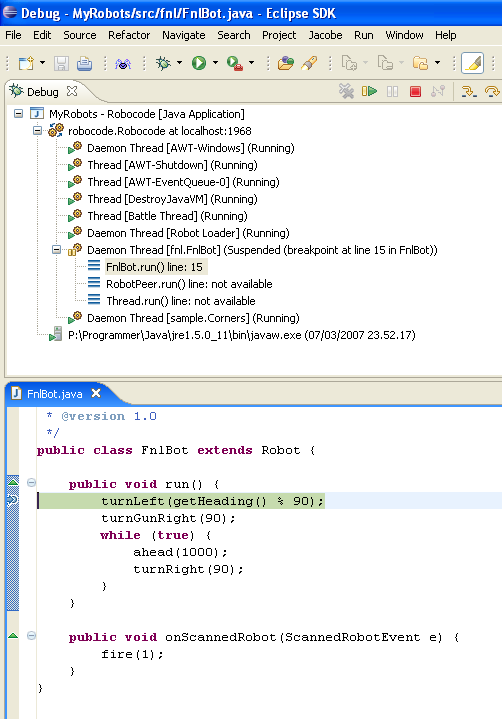
In the following example we set a breakpoint in the first line of the run() method of a robot. In this case, the robot is a simple Robot where each command takes exactly 1 turn to execute before it processes the next.
Right-click in the border area of the source editor till a popup menu shows up, where you can select Toggle Breakpoint.
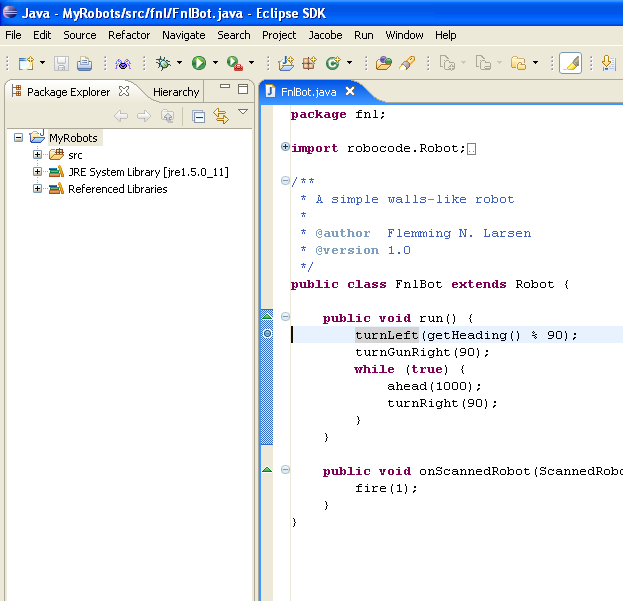
When the breakpoint has been set, a blue bullet will be shown beside the line to break at.
Now, let's try to start debugging our robot.
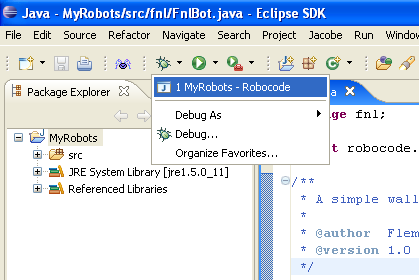
You start debugging by clicking on the debug button that looks like a "bug" and selecting your launch configuration. Alternatively, you could just click on the debug button, which will start debugging from the last launch configuration that was started.
When Robocode has started up, you start your robot by selecting New from the Battle menu or by using the hotkey Ctrl+N. Next, you select your robot and perhaps some opponent robots, and press Start Battle.
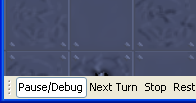
Notice: As soon as the battle begins, it is important that you must press the Pause/Debug button at the bottom of the battle window.
This will pause Robocode making debugging possible. If you do not pause Robocode, the game will run, and the robot that you debug will be seen as inactive when it hits a breakpoint, as it has not been active for some time. Besides, when Robocode is paused the internal time is also put on hold, which can be critical when debugging.
In this example, Eclipse should already have switched into the Debug Perspective. If this is the first time you debug with Eclipse, it might ask you if you want to switch into the Debug Perspective. Here I normally answer Yes.
In the Debug Perspective, the execution of your robot should already have stopped at our breakpoint.
If Eclipse has not stopped at our breakpoint, you should resume the battle by clicking on the Pause/Debug button until Eclipse stops at our breakpoint, and then click on the Pause/Debug button again to pause the battle.
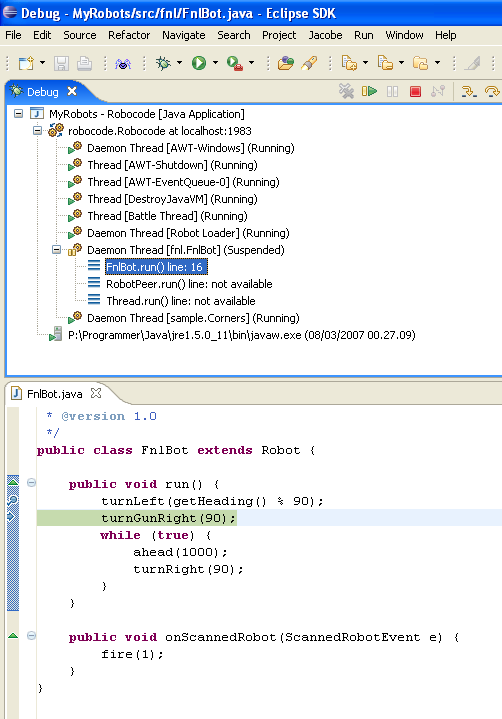
Now we want to step to the next line after our breakpoint. Therefore we press the Step Over button or alternatively press the F5 key.
Nothing happens? Well, Robocode is still paused, so we will not be able to proceed the debugging before we continue the battle. However, we do not want Robocode to rush with continuing the battle, playing lot's of turns before we get the chance of getting to the next line after our breakpoint. We just want to execute one turn at a time when debugging.
Here the Next Turn button becomes handy, which is located next to the Pause/Debug button at the bottom of the battle window. This button can only be activated when the game is paused, and is used for letting Robocode execute to the next turn of the battle, i.e. it performs a single turn.
In our case, we should carefully click on the Next Turn button approximately 4 times (might be more or less times) until Eclipse steps to the next line of code after our breakpoint. The reason why you have to hit the button several times is because it takes several turns until the robot has finished turning.
Now we have made a single step with our robot. So now we could set a breakpoint on the fire(1) line in the onScannedRobot() method, which is the event handler that is called whenever our robot scans another robot.
Here we don't want to make one turn at the time. Instead, we just resume the game by clicking on the Pause/Resume button.
When our robot scans another robot, Eclipse will jump right to the breakpoint set in onScannedRobot().
References
See also
Using Eclipse IDE
- Using Eclipse as IDE
- Creating a project for your robots
- Add robot project from an IDE into Robocode
- Creating a robot in Eclipse
- Running your robot from Eclipse
Robot API
Tutorials
- System Requirements for Robocode
- How to download and install Robocode
- The anatomy of a robot
- Getting started with Robocode
- My First Robot Tutorial
- Robocode Game Physics
- Scoring in Robocode
- Using the robot console
- Downloading other robots
- Learning from other robots
- Package your robot
- Frequently Asked Questions (FAQ)
- Articles about Robocode
- Starting Robocode from the command line
- Graphical debugging
